My Company Tab (eng)
My Company - Introduction
Coneix This section will show a "snapshot" of the state of your business and can make, for example, a billing analysis based on certain search criteria, display a summary of clients who meet certain requirements, among other functions described below. Access to the different options is done by clicking on the corresponding tabs.
My Company - Billing
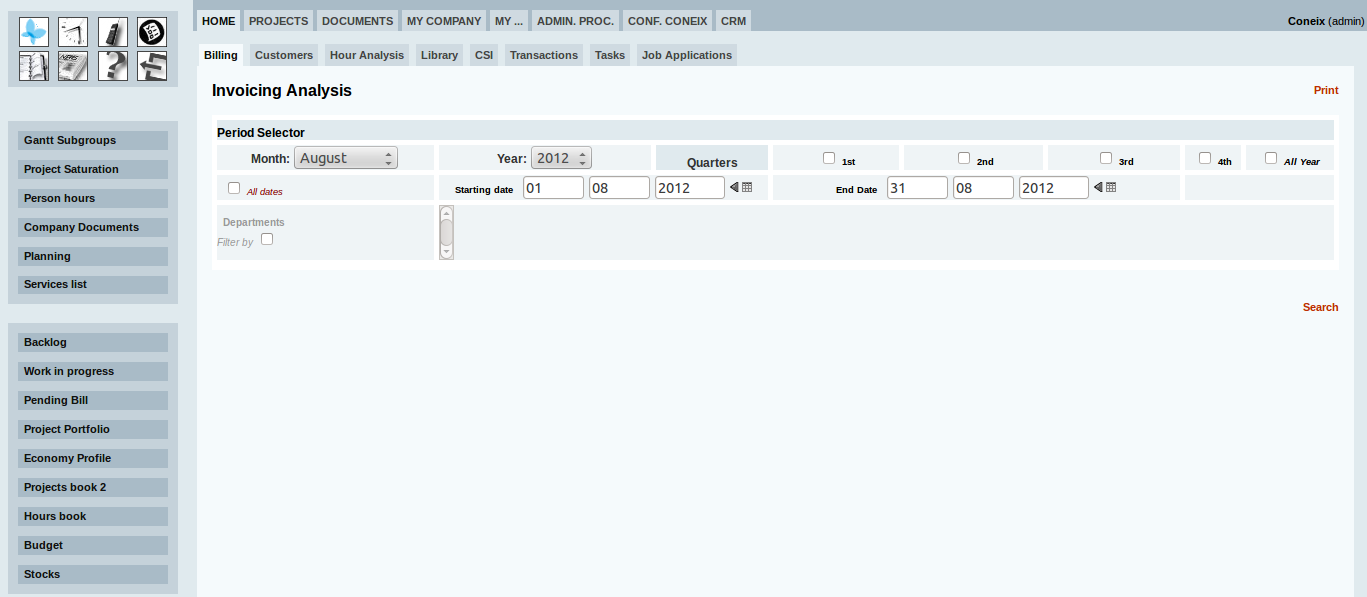
For rapid analysis dela turnover of our company, so just press this tab and then enter the date range you want to get the data. The date range could be defined by month, quarter, year, or their combination.
You can also filter results by company departments.
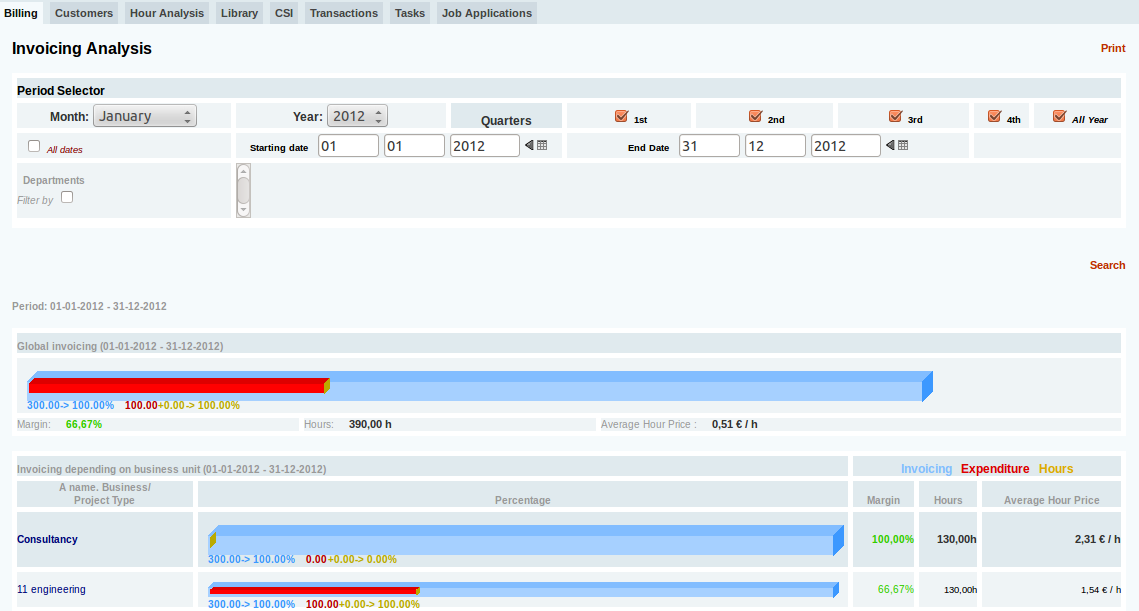
The query result is a chart like this, where we can see by business lines and / or departments: the margin, the hours spent and the resulting average price of working hour.
In the graphs shown in the amount billed, red shopping expenses, allowances and orange kilometers and the cost of the hours.
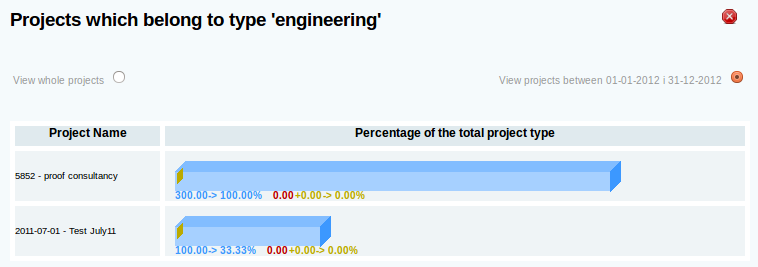
When clicking on the name of the type of project or business area opens the following screen display projects with data recorded in that area.
At the top are two checks that allow us to choose between viewing the entire project data (no date filter) or the previously selected period.
My Company - Clients
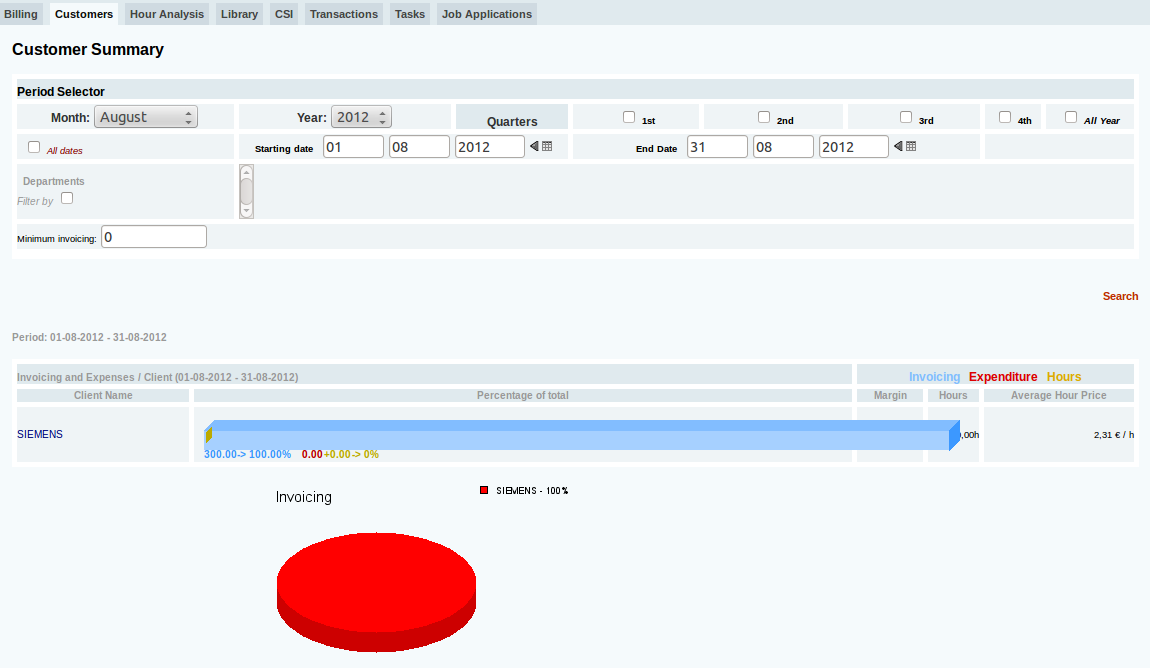
Analogously to the previous point, we can extract billing, expenses and average price of the time, this time, but, grouped by customer. As in the previous case need only select the / the period / s desired / s filtering it / s per department. In this case, we can also filter results by minimum turnover, in order to display only the most important customers.
The result is a table / figure as the one described below. This table is very easy to detect if a client has generated a lot of expenses against revenues, or the contrary, is very profitable if you work for a particular client.
My Company - Hours Analysis
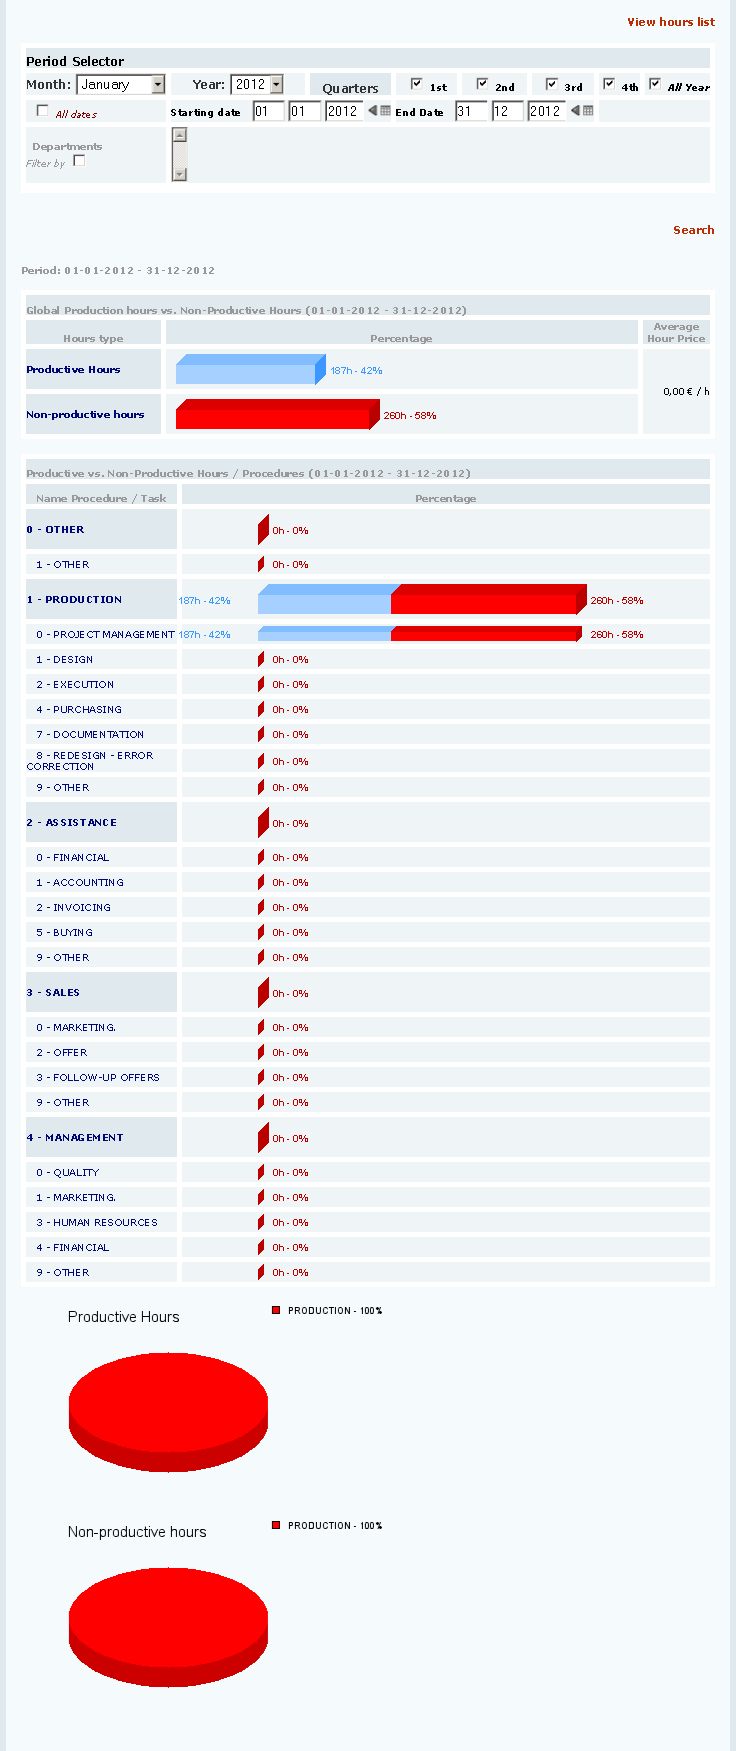
This section shows for each business area and / or department the relationship between hours productive and non-productive, with a graph like this:
This graph shows the departments that have more or less productivity.
Coneix understands that productive hours are those that belong to projects and invoices are unproductive hours that belong to projects without invoices.
That is, non-productive times can become productive hours issuing an invoice.
At the end of the project, having checked all the work done, the cost of non-productive hours are lost hours remaining.
My Company - Library
In this section we refer to the documents we have in our company Coneix.
It may look like a library, can cross up to four configurable fields simultaneously.
You can search by author, title, project, company, etc.
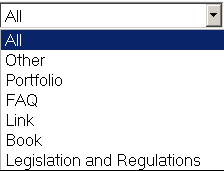
It can filter by document type. These types are subtypes of library news:
Also can be filtered by taxonomy (procedures, forms, etc..) Results are displayed as news library types, as follows:
We see in this case, as has been sought from the title of the book. You can see on the left you can filter by taxonomies, predefined, which may contain, in turn, qualifying groups.
My Company - RSI
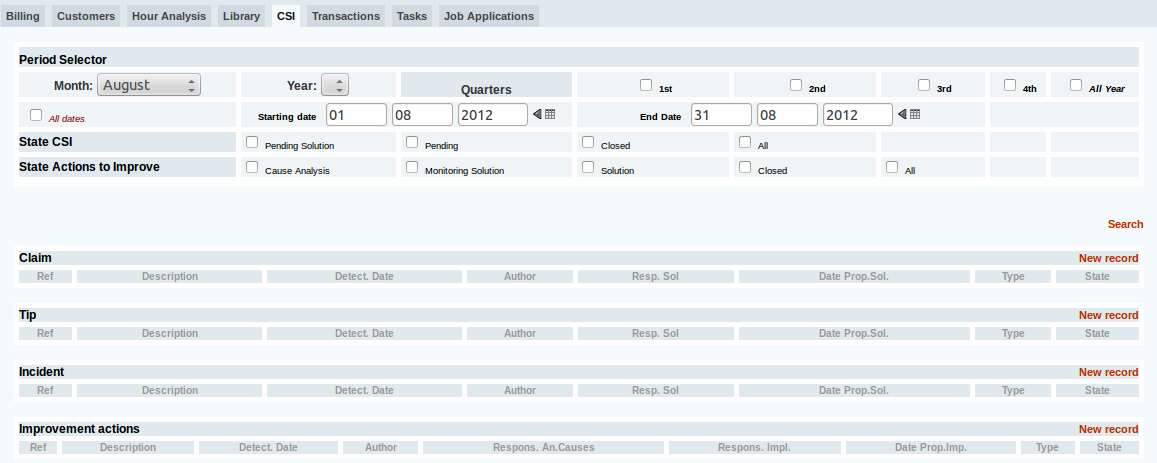
This tab shows the complaints, suggestions and incidents (RSI) open in our company. We can keep orderly records of RSI, know their status at any time and track. If you chose to add some kind of RSI opens a form where you can describe the incident or complaint, assign a responsibility to solve it (with a date), you can describe the problems, make comments, etc.
As for the display of existing RSI, you can filter by date of registration (as we have seen elsewhere), by state of the RSI (slope of solutions or closure, closed, etc..) And status of actions improvement.
Finally, using the left menu you can filter the results by the person responsible for resolving the RSI. It must be said that each user can only view records entered and those who have responsibility to solve. Administrators and managers (e.g. quality manager) can see all records.
My Company - Transactions
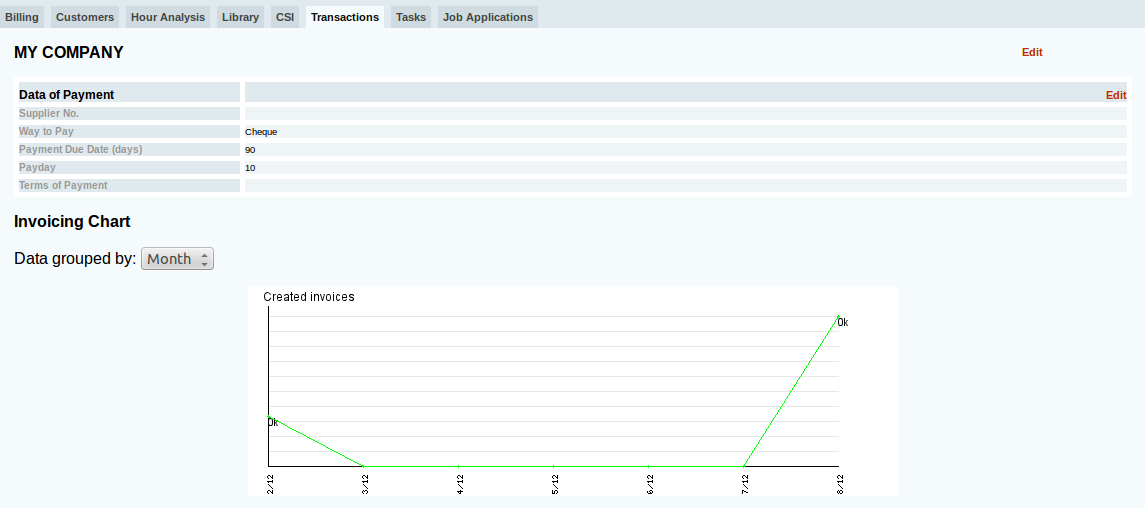
This tab shows a summary table of our economic preferences defined in the previous section, then two graphs, the first above shows the turnover of our company, invoices issued, the second in invoices. Both graphs can be displayed for years or months over the life of the company.
At the end of the window, there is the option to view the list of transactions of sale and purchase, indicating the name of the company, project associate, responsible for the transaction, amount, date ... We can see an example
My Company - Tasks
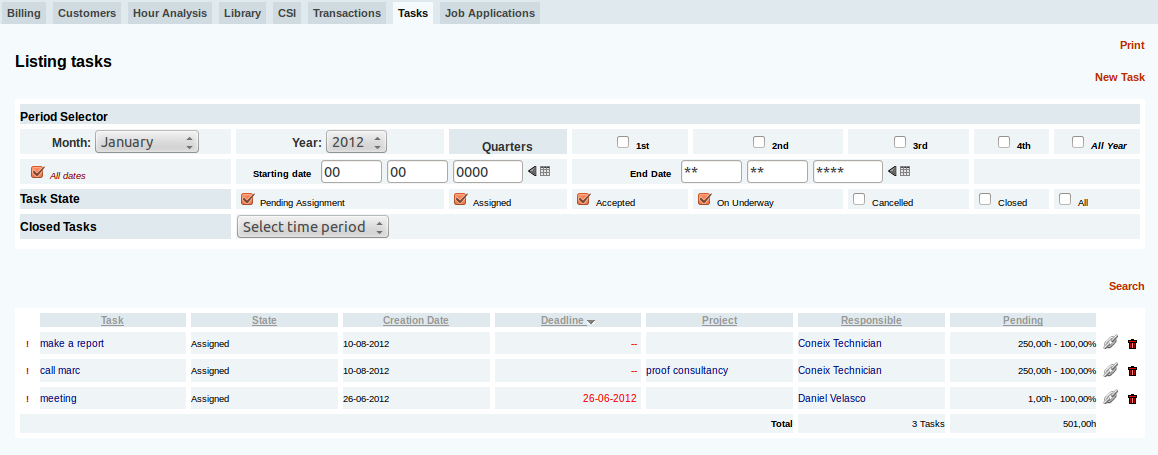
Here's the list of tasks for our company. You can filter indicating the dates, and / or the status of the task, depending on if pending allocation, assignment, running or closed.
We can sort the results by clicking on the title of each column, and change the direction (upward (downward) re-click on the title.
Furthermore, in this window are more menu items on the left, through which we show only the tasks related to the author of it, the owner of the task or project assigned.
My Company - Left Common Menu
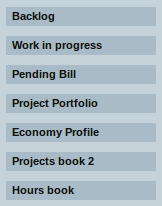
In the left area of the screen aprece Coneix whatever the menu sseleccionada subtab common to them all, with the following options:
Sub-grtoups Gantt
Produces a Gantt chart of projects in our portfolio. It shows the projects and class subgroups.
Project Saturation
Graphically displays for weeks or months the workload of each of the people we have in the team. Total and per project.
Man Hours
Displays numerically for weeks or months the workload of each of the people we have on the team. Total and per project.
Work in Progress
List each project the amount of each month of the ongoing work of the project.
The last column shows the increase in work in progress between the last two months.
Work in progress (TEC) is the amount of work performed and billed to the customer at cost. Coneix is calculated using the following formula: TEC = coste proyecto hasta la fecha - facturas_emitidas Si TEC < 0 => TEC = 0 Si TEC > TotalVentasProyecto - Facturas_emitidas => TEC = TotalVentasProyecto - Facturas_emitidas
Pipeline
This tab allows you to view our company projects separated by blocks depending on the status of the project. Moreover, we can define search parameters to filter the results of it.
The first two filters are configurable (enable indicate which fields we want to find specific text). You can also filter based on the date of an event selectable, or by department, taxonomy (if defined) and / or class (if defined).
As for the output, is shown: the client, the date of supply, business unit and sub-unit in which the project is currently the selling price and the amount billed, and finally the project percent complete and current on billing.
Alarm List
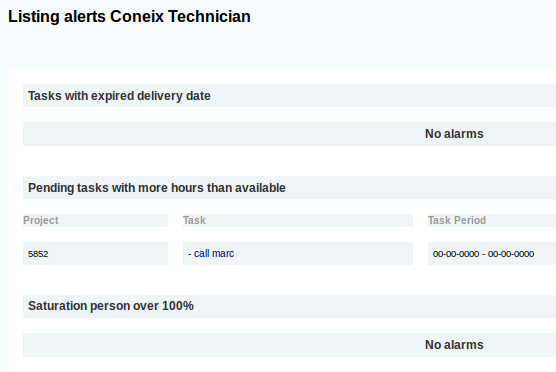
Used to check if everyone has introduced the hours and detect whether the information available in Coneix is outdated as there are people who have not updated your timecard.
This function reports:
- People no times entered the last day
- People with hours introduced less than 50% the last day
- Weekly hours not introduced
- Monthly Hours not introduced
- Tasks with deadline expired
- Tasks with hours slopes greater than the available hours
- Saturation person over 100%
